This tutorial will cover the basics of using the vmstat tool to monitor system performance using quick and simple examples. Although the Linux distribution in use does not matter significantly for this guide, it’s good to note that we tested it on a Debian 10.06 system.
Introduction to vmstat?
Vmstat is a command-line tool used to monitor and report resource usage on your system. It monitors the usage of system resources such as system memory, processor, and swap.
It gives real-time data reports that can help system administrators and Linux troubleshooters quickly and easily determine causes of performance issues and high memory usage in a system.
How To Use vmstat
To use the vmstat tool, execute the command vmstat in the terminal. You will get an output similar to the one shown below:
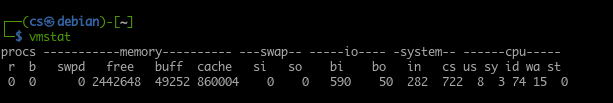
Using the command vmstat with no arguments outputs an average view of system resource usage since the last system reboot. To filter precise information, use the command:
After using the above syntax, vmstat reports the average system used since the last reboot subsequently until the count value is reached. For example, if the count value is 10, vmstat will display system information usage 10 times. The command also specifies that vmstat should report data every interval value (in seconds).

Vmstat usage
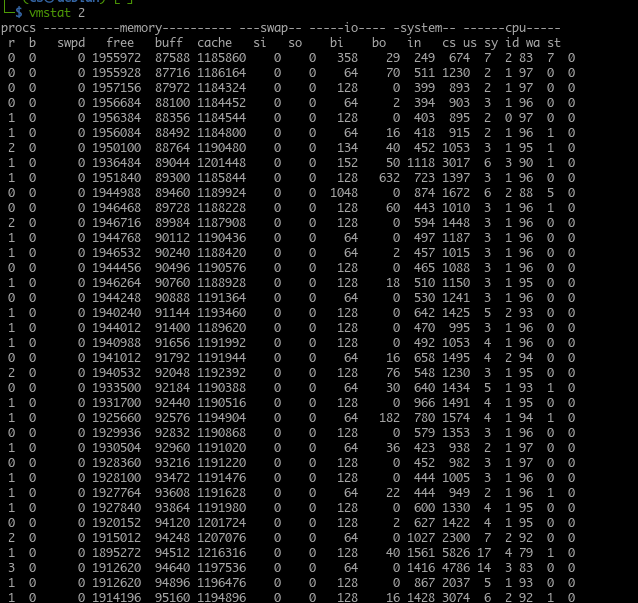
Depending on the information or type of problem you are diagnosing, you will often run vmstat with a small interval value. Consider the following vmstat output. Report every 2 seconds for 15 times.
You can also execute the vmstat command without the count argument. Doing that will give current system usage reports in real-time for the specified interval.
For example:
It is a better option to output the report from vmstat to a log file to read and analyze later. To stop a running vmstat session, press the CTRL + C keys.
By default, vmstat will show memory reports in kilobytes with a single kilobyte equivalent to 1024 bytes. To configure vmstat to use 1 kilobyte as 1000 bytes, use the command:
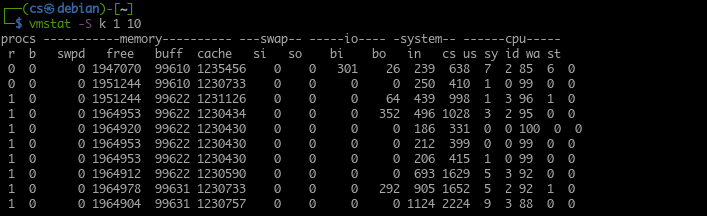
Where you want to use megabytes to display memory size, use the -S m argument, and Vmstat will report one megabyte as equivalent to 1000 kilobytes.
Understanding vmstat output
As we mentioned, vmstat reports the up-to-date system state. It provides useful information concerning the condition of the system, which is helpful in troubleshooting performance issues.
Given this, it’s important to understand what the output from vmstat represents.
Vmstat groups the output information in columns. These columns contain related information depending on the command specified. The following are some of the columns from a vmstat output.
1: Procs Column
The procs table represents the number of jobs in the queue (jobs waiting to run). This column can help you determine the processes blocking the system from executing other jobs.
Inside the procs column, you will find r and b columns. These display the total number of processes waiting to go into the processor and the total number of functions in a sleep state.
In most cases, values in the b column are 0.
2: Memory Column
The memory column displays information on the total amount of free and used memory in the system. This output is similar to the free command.
Under the Memory column, there are four other columns:
- Swapd
- Free
- Buff
- Cache
The swap or swapd tab displays the amount of memory already exchanged (swapped) out into a swap file or swap partition.
In the free column, you will find information on the amount of unused memory. (unallocated memory).
The buffers column displays information on the amount of memory in use. (allocated memory).
Finally, in the cache column, you’ll find information about allocated memory that can be exchanged to the disk if the resources are needed.
3: Swap Column
Next, we have the swap column used to report the speed at which memory gets swapped to and from the swap file or partition.
Using the swapd and total disk activity, vmstat allows you to calculate the disk activity relationship with the swap system.
In the swap column, you will also find the si and columns used to show the amount of memory transferred from swap to main memory every second and the amount of memory moved to swap from main memory every second.
4: I/O Column
In the next column, you will find information regarding system input and output actions, expressed in reading and write per block. Under the I/O column are bi and bo columns, representing the number of blocks received from the disk per second and the number of blocks sent to disk per second, respectively.
5: System Column
The system column displays information on the total number of system processes per second. System column has two more columns, i.e., in and cs. The first column shows system interrupts (includes interrupts from the system clock) per second. The cs column indicates the number of context switches made by the system to process all tasks successfully.
6: CPU Column
The last column is the CPU. This column displays the CPU resource usage. The CPU column has four main columns under it.
- us
- sv
- id
- wa
The first column (us) represents the total amount of time used by the processor on tasks created by the user.
The next column (sv) displays information related to the time the processor uses on kernel processes.
The id column shows the amount of time the processor spent on idle.
Finally, the (wa) column shows the total amount of time used by the processor on wait I/O operations.
Adding all values in the CPU columns adds up to 100, representing a percentage of available time.
Conclusion
In this tutorial, we learned how to use vmstat, a tool used to report system resource usage. We also covered how it works and how we can query for specific information. We also discussed how to understand vmstat output and use it to troubleshoot system resource problems.