Netdata is a free and open-source distributed, real-time monitoring application that runs across various computing devices; physical servers, cloud servers, containers, and even IoT devices. It collects a great deal of data and visualizes it on sleek and interactive dashboards. We are going to install Netdata on Ubuntu 20.04 LTS and then demonstrate just how various metrics are visualized.
Step 1: Install Netdata using kickstart.sh script
This is the most preferred way of installing Netdata because it allows you to pass other arguments on the same command to customize the installation process. Most importantly, this method seamlessly works across all distros.
At the start you might want to view more information about Netdata. Use the APT command as follows.
The output provides Netdata information such as the latest version, origin, installation size, and a description of the package.
To install Netdata, simply run the kickstart script as follows.
As you will notice, the script performs a bunch of operations. First, it autodetects the Linux Operating system and distribution you are running and later install the requisite packages.
From the output below, you can see that our OS information has been retrieved and displayed to stdout by the script.
The script then proceeds to check if you have an existing instance of Netdata, and if there is one, the script updates Netdata instead of installing Netdata afresh.
Thereafter, the script pulls Netdata from the Git repository and stores it in /usr/src/netdata.git. Path. All the required files and dependencies are thereafter installed and the package index updated.
Along the way, the location of Netdata files including configuration files, web files, db files and log files will be displayed as shown.
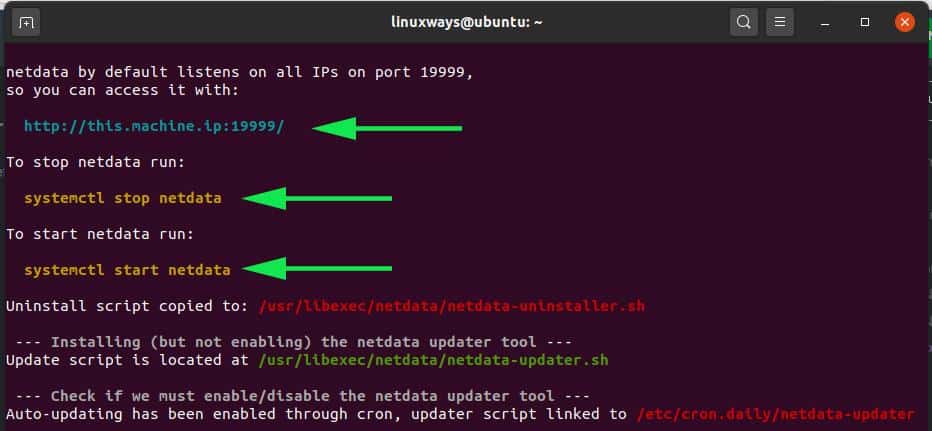
Towards the end, basic instructions on how to access Netdata dashboard along with starting and stopping Netdata will be displayed.
The updater script netdata-updater.sh is then added to /etc/cron-daily f to ensure that Netdata is continually updated.
As the installation wraps up , the script will inform you that Netdata was successfully installed and is now running.
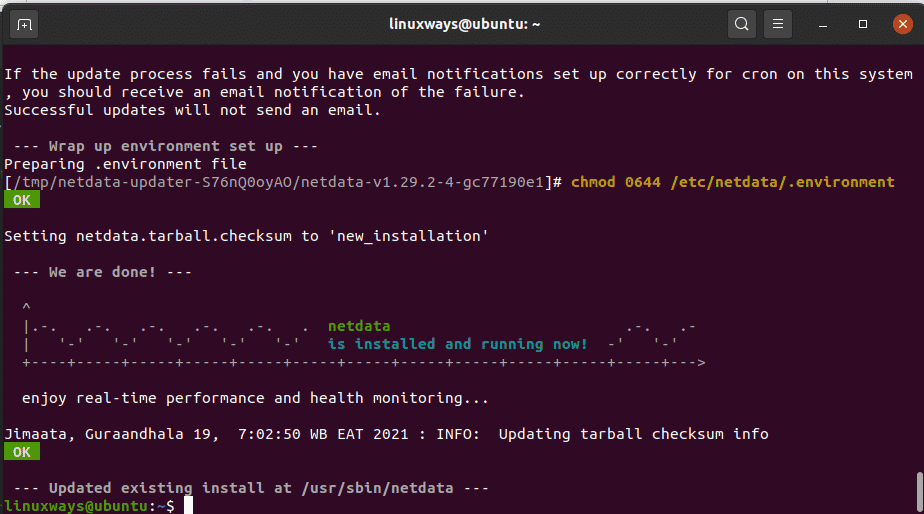
The entire installation takes quite a while you might want to take a short break or simply hang around until it is completed.
Step 2: Confirm Netdata is running
Netdata is finally installed. However, it’s prudent to verify that indeed Netdata service is active and running.
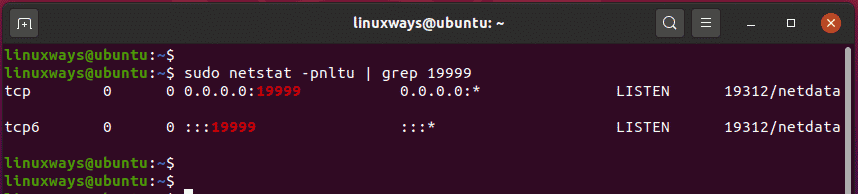
By default, Netdata listens on port 19999. To confirm this, run the netstat command below:
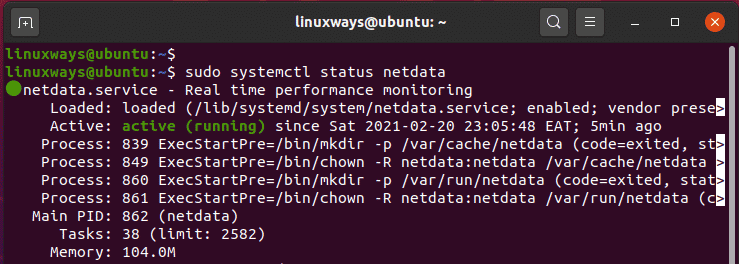
Also, you can confirm that Netstat systemd service is running by invoking:
The output confirms that indeed, Netdata is running as we would expect.
Step 3: Configure firewall
At this point, you can access Netdata from the browser from your host system. However, if UFW firewall is enabled, this will not be possible. With that in mind, port 19999 needs to be allowed.
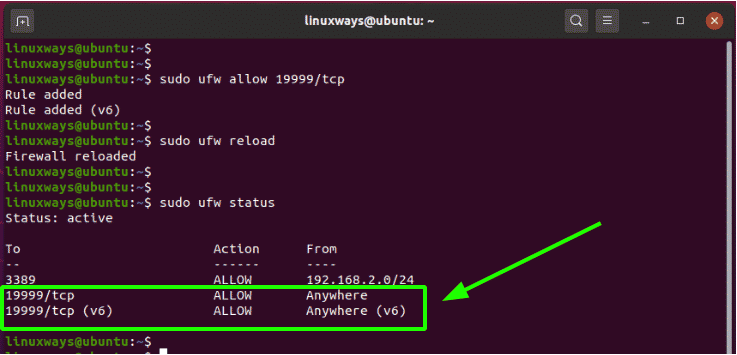
So run the following commands:
$ sudo ufw reload
Then confirm that port 19999 is allowed on the firewall.
Step 4: Access Netdata dashboard
All the configurations are done and dusted. As we wrap up, we are going to access Netdata by browsing the following URL. Replace the host-ip with your host’s real IP address.
And voila! Netdata dashboard will come into view with elegant and beautiful visualizations displaying a System overview of the main system metrics such as CPU utilization, network bandwidth stats, disk read/write and RAM utilization.
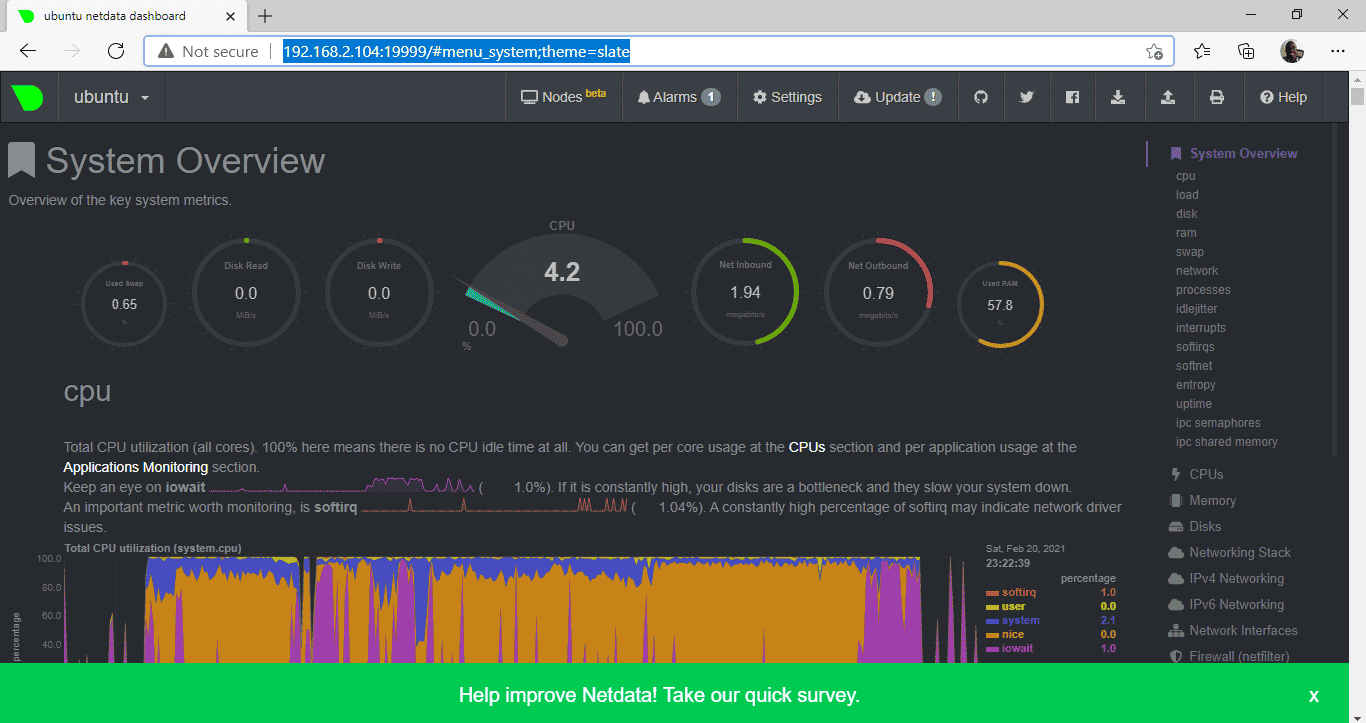
On the right sidebar are additional system metric options that you can click on to view dashboards that visualize real-time statistics.
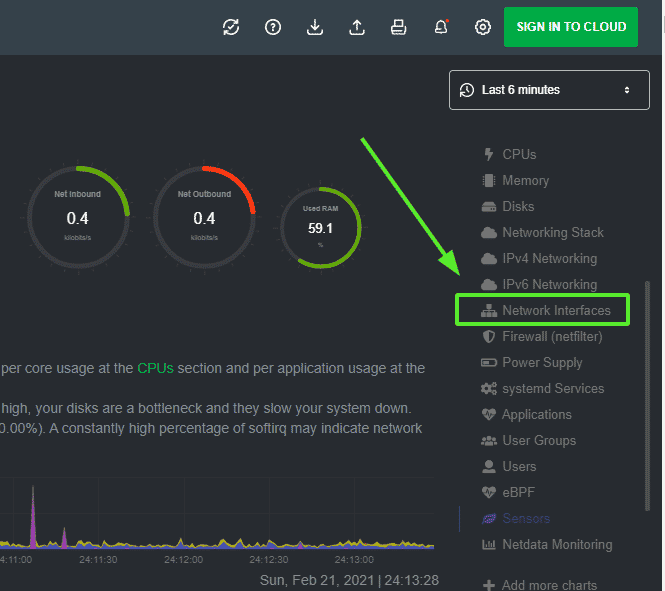
For instance, to have a glance at the network bandwidth, select the ‘Network Interfaces’ icon as shown.
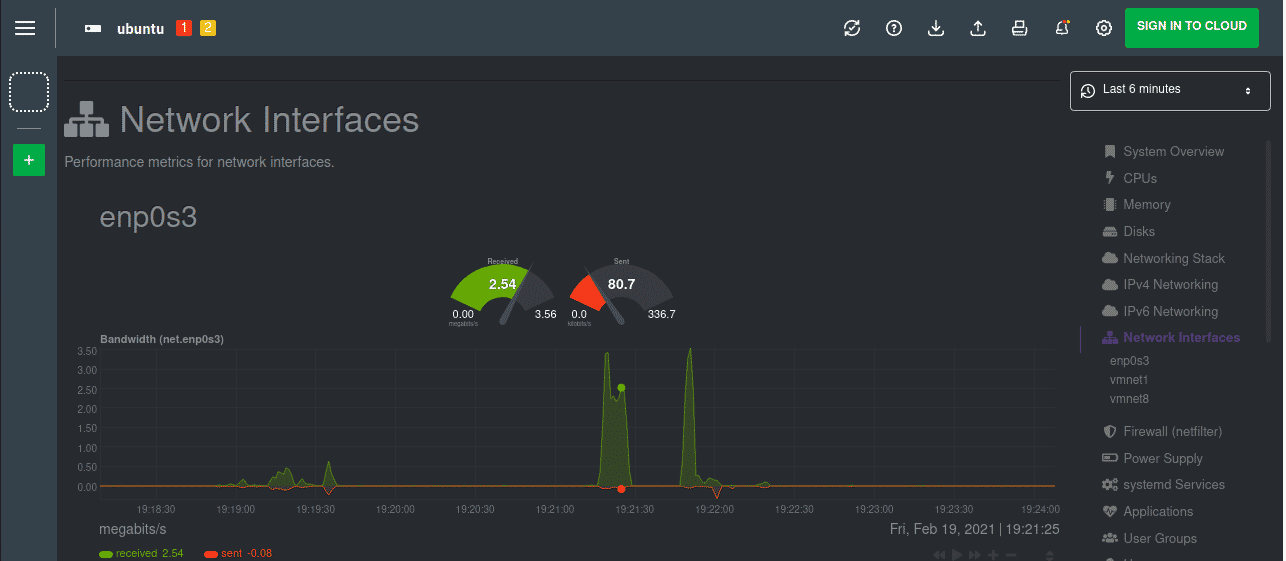
The ‘Network Interfaces’ dashboard will be displayed with bandwidth statistics on various network adapters.
Conclusion
Netdata provides an excellent solution for monitoring your single node in real-time. You can configure alarms and notifications which can be triggered when a certain event or threshold is exceeded. Give Netdata a try and let us know about your experience.